Get your own data from a Google Sheets into a custom featured Google Map with just a few clicks.
Listing updated:March 12, 2024
Works with:
911K+
Overview
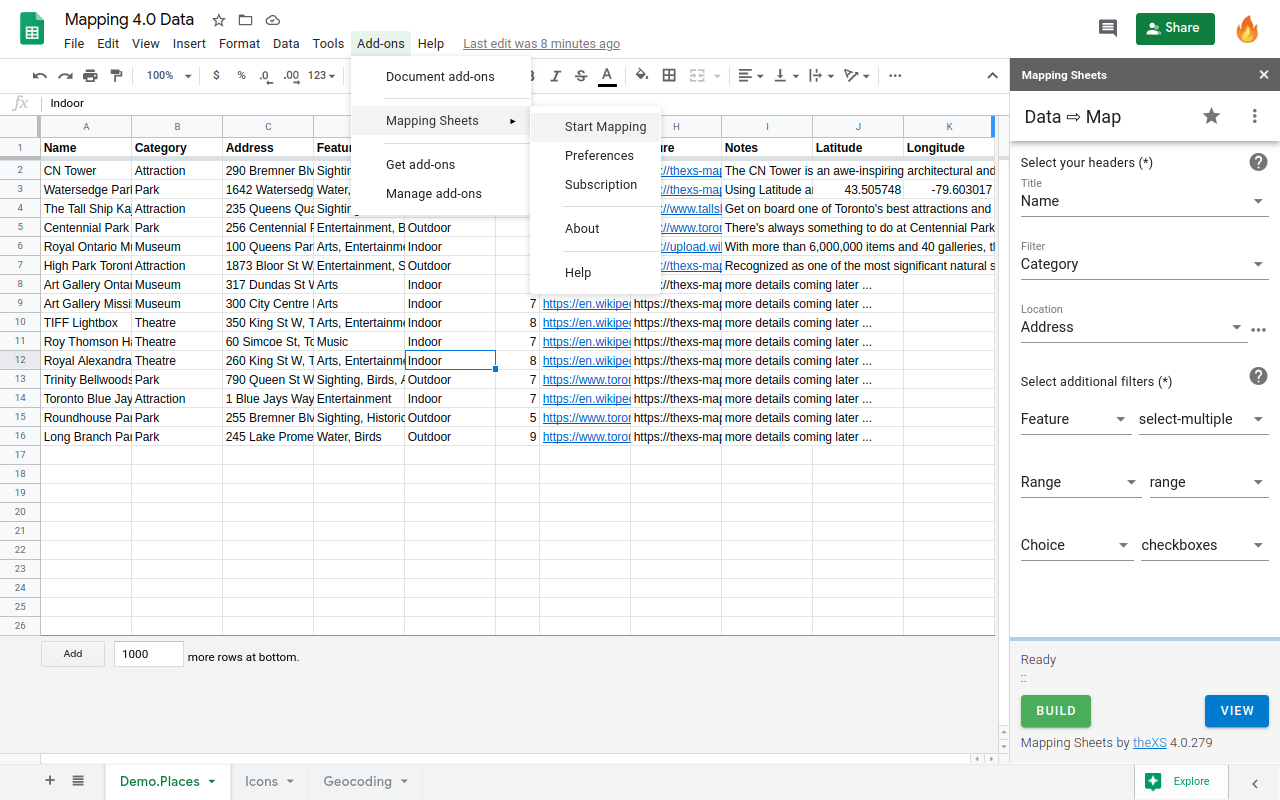
Plotting your own data onto a map is in great demand for businesses and individuals. Either to show each location details in an Infowindow or for filtering over the map based on several conditions, but also to find locations within a distance to a place and ultimately to calculate the optimal route directions for your next travel around.

For the first time, the Mapping Sheets add-on is providing an easy way to process your data directly from Google Sheets onto a map.

First BUILD: the Mapping Sheets add-on will process your data from Google Sheets and create a .json file in your Google Drive, ready for mapping. Then VIEW: the Mapping web app will gather that .json file and plot your data directly onto a map. 

Update: Mapping 4.0 is the default version since 2020-12-28, with a better look and performance, plus a bunch of new features and options.
■ Maps running on version 3.x will continue to work as before with the old Url
■ However, when updated they will require to use the new Mapping 4.0 Url
■ Special attention is required when using the Unattended BUILD option

➡ Mapping Sheets add-on
A Google Sheets add-on available within your own Spreadsheets under the Add-ons menu

⇨ Plans and Features
  ■ Basic Free Plan: Up to 50 locations per map. Includes all the basic (−) features.
  ■ Advanced Premium Plan (†): No restrictions in the number of locations per map. Includes all the basic (−) and advanced (+) features.
(†) Disclaimer: The Advanced Premium Plan does not avoid service errors, limitations and quotas like Google Geocoding daily quota limit exception, etc.
 ■ Extended Custom Plan: All of the above plus tailored solutions, workflows and integrations as per client requirements, upon request (∗).

⇨ Getting started with your data on Google Sheets
  ■ Enter all your data for mapping onto a sheet, or insert a demo sheet from the ⋮ menu
  ■ Select the 3 column headers you want to use for Title, Filter, and Location when building the map 
  ■ Click BUILD to process your data into a .json file in your Google Drive, ready for mapping
  ■ Click VIEW to open the Mapping web app and see all your locations on a Google Map
  ■ Check the User Preferences for more options and settings

➡ Mapping web app
A generic data driven web app using Google Maps that loads data and settings from a .json file in your Google Drive.
The Mapping web app is free to access, publicly available with no fee, no credentials are required for access, for anyone to use.

➡ Main features (add-on and web-app)
⇨ Basic (Free) Features:
− Select the 3 data headers you want to use for Title, Filter, and Location
− The Title determines the value of the header in the standard Infowindow
− The Location (address) is used for Geocoding to get the coordinates on the map
− The Filter will group mapping locations using the same icon image
− Define a Location Template for Geocoding, using placeholders for headers, if the full address is split across several columns
− Add an additional filter (1) using check-boxes or numeric slider, working in combination with the main filter to show matching locations
− Optional quantity tags next to each filter value, applicable only for checkbox filter types
− Use optional multi-value filter (with your own custom separator)
− Using expansion panels for main and additional filters in the sidebar for better usability, with the option to set which panels are expanded on loading
− An option to select or deselect all values within each filter section on the panel header, as applicable for better usability
− Choose to show the filtering sidebar collapsed on loading the map
− Improved map sharing workflow with a prompt dialog and detailed documentation
− Unattended time-based BUILD if something has changed in the datasheet within an hour or more, after the last BUILD
− Include additional columns to display more information on the map
− Set the optional data headers row in case it's not the row #1 as default
− Use default icons and colors, or assign your own icons and colors to each filter unique value
− Select custom data to show in the icon title (mouseover tooltip) based on a template string
− Click a marker icon to open an Infowindow showing all the details of a specific location
− Select the data to display in the Infowindow based on a list of your headers
− Use image file secure urls (https:// ending on jpg, gif, png, svg) to show an image in the Infowindow
− Use valid urls to show links (with a custom text anchor) in the Infowindow
− Assign the width and height for the Infowindow and choose if the height is fixed (locked) or flexible
− Select custom data to show in the right-side Listing as plain text, based on a template string
− Define a full custom markdown template for the Listing item content to show as rich html
− Access some extra actions from the add-on sidebar ⋮ menu
− Select an icon set from a list of available options to set your icons shape
− Using Marker Clusters to combine markers of close proximity into clusters, for better performance and navigation
− Optional cluster settings for size, zoom and a toggle button to hide/show clusters as convenient
− Spreading out overlapping location icons on click, in a spider-like approach
− Select the map controls to show in the map among the standard available options in Google maps
− Set and apply a custom style definition for your map, with thousands available online
− Select the map styles to make available in your map, among the standard options in Google maps plus your own custom style definition
− Instantly filter across the entire data content as you type in the search box
− Use check-boxes for easy grouping and filtering locations according to the main filter
− Fast filtering by using a debounce asynchronous function, that wait/queue user's requests on filtering
− Choose to fit the zoom and center of the map to show all selected locations
− Show or hide the right-side Listing of selected locations
− Available in more than 30 languages (thanks to all the translators, including Google Translate 😉 as the top contributor)
− Take advantage of the many more features provided by Google Maps

⇨ Advanced (Premium) Features:
+ Find a place on the map by typing in an autocomplete text box and center the map there with the choice of a filtering circle around
+ Circle around that place that would activate on a click with editable radius, with the option to filter locations within its boundaries
+ Set the headers to use on the optional Search filter for better results
+ Add several additional filters (up to 5) with an extended filter type list to choose from
+ Use several additional filters and other filtering options, working in combination with the main filter to show matching locations
+ Filtering within a section works with “inclusive or” logic, either selected values would pass the section test
+ Filtering across sections works with “and” logic, a location must pass the test in all the sections to show on the map
+ More and better filter types to choose from as additional filters
+ Filter from a list of values as checkboxes (checkboxes, checkbox-list) to choose some or all of them
+ Filter for a value smaller than (<= slider) a number,  as a standard slider
+ Filter for a value greater than (>= slider-right) a number,  like a standard slider with the active section on the right
+ Filter numeric values within a range (inclusive range) using a slider range with two 'thumbs'
+ Filter select a single value (select) within a searchable list of unique values
+ Filter select multiple values (select-multiple) within a searchable list of unique values
+ Filter select a single date in a calendar (date values must be on ISO yyyy-mm-dd format as plain-text under the selected column)
+ Filter select a date range (from & from - to inclusive) dates in a calendar (date values must be on ISO yyyy-mm-dd format as plain-text under the selected column)
+ Define a full custom markdown template for the Infowindow content as an alternative for the default tabular content
+ Use markdown content within your data under specified headers
+ Use an alternative custom icon shape (icon set) based on a selected header values
+ Use an alternative custom icon size (scale) based on a selected header values
+ Set your own custom Mapping web app page title to show in the browser
+ Find an optimal directions route for the locations showing on the Listing, with options for round trip and start/end
+ Allow for just a map with your locations by disabling everything else (menu, sidebar, listing, infowindow, controls, styles, etc)
+ More features in the queue already under development (some from the extended custom features below)

⇨ Extended (Custom) Features and Roadmap:
Most of the features under the Basic and Advanced sections above started here, as an extended custom feature for some client(s), and later moved up to mainstream public features. Some of the features listed below would follow that path eventually, depending on actual demand and available resources.
The current status of these extended custom features vary from 'thinking-about-it' to 'working-for-some-clients' including 'designing', 'developing', 'limited-availability' and others in between. The sorting of the following list does not represent their current status, neither their priority, nor their perceived value.
Please, feel free to contact us through the support form if you are interested in any of these extended custom features or if you have a new feature request to include on this list.
∗ Additional routing options without optimization as listed (as-is) and reverse order
∗ Allow for manual sorting (drag and drop) on the Listing when showing less than 50 locations
∗ Writing custom code on post-processing the data, upon client request for specific project requirements
∗ Custom layers using Overlays, GeoJSON, KML & GeoRSS, OGC:WMS, OSM tiles, Isoline, Boundaries and others (extended details on the layers page as available)
∗ Options for export and import Preferences settings
∗ Drawing shapes (like circle, rectangle, polygon or even a freehand contour) on the map with the option to filter locations within
∗ Set a trip route directions on the map, then draw a buffer boundary at a distance around the route to filter locations within
∗ Get the weather forecast for a location on the map on a click from the Infowindow
∗ Use your own Info section (about) markdown content instead of the default by theXS
∗ Save the current map state (filters, panels, center, zoom) to reload it on the next time you open that map
∗ Find my location (find & follow me) options and center the map there with the choice of a filtering circle around
∗ Circle around that location that would activate on a click with editable radius, with the option to filter locations within its boundaries
∗ Add and update (editing) locations data in the source datasheet directly from the Mapping web app
∗ An option to show the full header name on mouse hover the headers in the standard Infowindow, useful when having too long headers in the datasheet
∗ Geocoding in bulk client-side for a large number of locations
∗ Filter select multiple values (select-dynamic) within a searchable list of unique values, but with dynamic content based on current visible locations
∗ Filter select date-after or date-before to show locations with dates either after (>=) or before (<=) the selected date
∗ Extra panel section in the sidebar with checkboxes, to switch on and off any extra layers (e.g. heatmap, circles, geoJSON and so on)
∗ Asset tracking as a realtime layer of ‘moving icons’ on the map
∗ Real time map update on form submit new data
∗ Save the json map data file in Google Firebase (storage), as an option to current Google Drive, to improve the loading for public maps
∗ Add a custom label to the location icons based on a selected header values and other options

➡ Relevant links and references
+ Get the add-on from Google Workspace Marketplace
+ FAQ, Feedback, and Support
  https://www.thexs.ca/xsmapping/faq-and-feedback
+ Limitations, Known Issues and Common Errors
  https://www.thexs.ca/xsmapping/limitations-known-issues-and-common-errors
+ Advanced Premium Plan subscription
  https://www.thexs.ca/xsmapping/advanced-premium-plan-subscription
+ User Preferences and Settings
  https://www.thexs.ca/xsmapping/mapping-sheets-add-on-preferences
+ Learn more about Filtering on your map
  https://www.thexs.ca/xsmapping/filtering-on-your-map
+ Privacy, TOS, SLA and Liability
  https://www.thexs.ca/about-thexs/legalese
+ Demo map with most of the Advanced Premium Features
  https://mapping.thexs.app/map.html (new version 4.0)
  https://thexs-mapping.firebaseapp.com/mapping.html (version 3.0)
Additional information
PricingFree of charge with paid features
Developer
Non-trader
Privacy policy
Terms of service
Mapping Sheets will ask for the permissions shown below. Learn more
Mapping Sheets will need access to your Google account
This will allow Mapping Sheets to :
See, edit, create, and delete only the specific Google Drive files you use with this app
View and manage spreadsheets that this application has been installed in
Display and run third-party web content in prompts and sidebars inside Google applications
Connect to an external service
Allow this application to run when you are not present
View and manage data associated with the application
See your primary Google Account email address
See your personal info, including any personal info you've made publicly available
Loading
Search
Clear search
Close search
Google apps
Main menu